DESENVOLVIMENTO
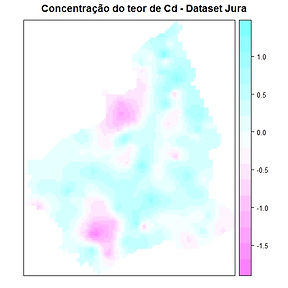
1) Mapa de concentração do teor de “Cd” no data set Jura
data(jura)
jura.grid <- juragrid.dat
coordinates(jura.grid)=~Xloc+Yloc
gridded(jura.grid) = TRUE
class(jura.grid)
coordinates(jura.pred)=~Xloc+Yloc
class(jura.pred)
m <- vgm(0.14401001, "Exp", 0.3414199, 0.02213461)
x <- krige(log(Cd)~1, jura.pred, jura.grid, model=m)
class(x)
image(x)
spplot(x[1], main='Concentração do teor de Cd - Dataset Jura')
2) Mapa base
data(jura)
plot(prediction.dat[,1],prediction.dat[,2],xlab="Xloc",ylab="Yloc",main="Mapa base - Pontos de coleta")

3) Sumário da variável
data(jura)
j <- prediction.dat
summary(j$Cd)
Resultado:
Min. 1st Qu. Median Mean 3rd Qu. Max.
0.1350 0.6375 1.0700 1.3090 1.7150 5.1290
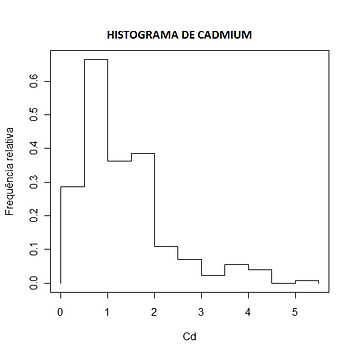
4) Histograma
data(jura)
ht <- prediction.dat
x.norm<- ht$Cd
h<-hist(x.norm,breaks=10)
xhist<-c(min(h$breaks),h$breaks)
yhist<-c(0,h$density,0)
xfit<-seq(0, 70, by=1.0)
yfit<-dnorm(xfit,mean=mean(x.norm),sd=sd(x.norm))
plot(xhist,yhist,type="s",ylim=c(0,max(yhist,yfit)),xlab="Cd",ylab="Frequência relativa",main="Frequências relativas de Cd - Dataset Jura")
5) Box-plot
data(jura)
h<-prediction.dat
boxplot(h$Cd,range=1.5, main='Box-Plot dos teores de Cd – Dataset Jura')

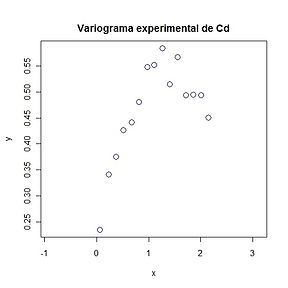
6) Variograma experimental
data(jura)
vgm1<-variogram(log(Cd)~1, locations=~Xloc+Yloc, data=prediction.dat)
x=range(vgm1[,2])
y=range(vgm1[,3])
plot(x,y, asp = 10, type = "n", main="Variograma experimental de Cd - Dataset Jura")
points(vgm1[,2],vgm1[,3],col="blue",cex=1.5)
f<-fit.variogram(vgm1,vgm(0.19, "Exp", 1.2, 0.08))
v<-vgm(f$psill[2], "Exp",f$range[2],f$psill[1])
ff<-variogramLine(v,maxdist=2.2 ,n = 15 , min = 0.06 )
points(ff[,1],ff[,2],col = "red")
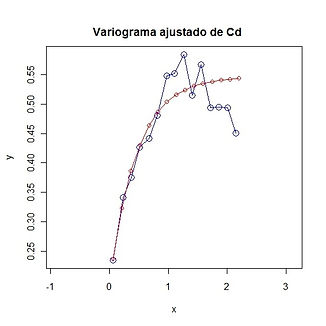
7) Variograma ajustado
data(jura)
vgm1<-variogram(log(Cd)~1, locations=~Xloc+Yloc, data=prediction.dat)
x=range(vgm1[,2])
y=range(vgm1[,3])
plot(x,y, asp = 10, type = "n", main="Variograma ajustado de Cd - Dataset Jura")
points(vgm1[,2],vgm1[,3],col="blue",cex=1.5)
lines(vgm1[,2],vgm1[,3],col="blue")
f<-fit.variogram(vgm1,vgm(0.19, "Exp", 1.2, 0.08))
v<-vgm(f$psill[2], "Exp",f$range[2],f$psill[1])
ff<-variogramLine(v,maxdist=2.2 ,n = 15 , min = 0.06 )
points(ff[,1],ff[,2],col = "red")
lines(ff[,1],ff[,2], col = "red")